A 2012 Raspberry Pi, a 320×240 touchscreen, and four things that failed silently while reporting success.
I have a dashboard. It runs in a container, it pulls from five services, and it lives at a URL. Which means I see it when I go and look at it, which is less often than I intended when I built the thing.
So I wanted a physical head for it. Something on the desk showing the numbers whether I asked or not.
I had the parts already: an Adafruit PiTFT 2.8″ (product 1601) — 320×240, resistive touch, talks SPI — sitting on a Raspberry Pi that used to be my Pi-Hole backup but was retired a year ago when my Proxmox cluster was spun up.
Raspberry Pi Model B Rev 2
Single core. ARMv6. 512 MB of RAM, of which 427 MB is usable after the GPU takes its cut. This board is from 2012, and it has done everything from functioning as a print server, to a mini pc for multiple linux distros to a pi-hole node. It was time to give it a new life, again.
The obvious build is a kiosk browser pointed at the dashboard. That is not happening here. Chromium’s minimum is more than this board has, and even if it started it would spend its life swapping.
The interesting constraint is that this isn’t a performance problem you can optimise around. It’s a hard no. So the architecture has to invert.
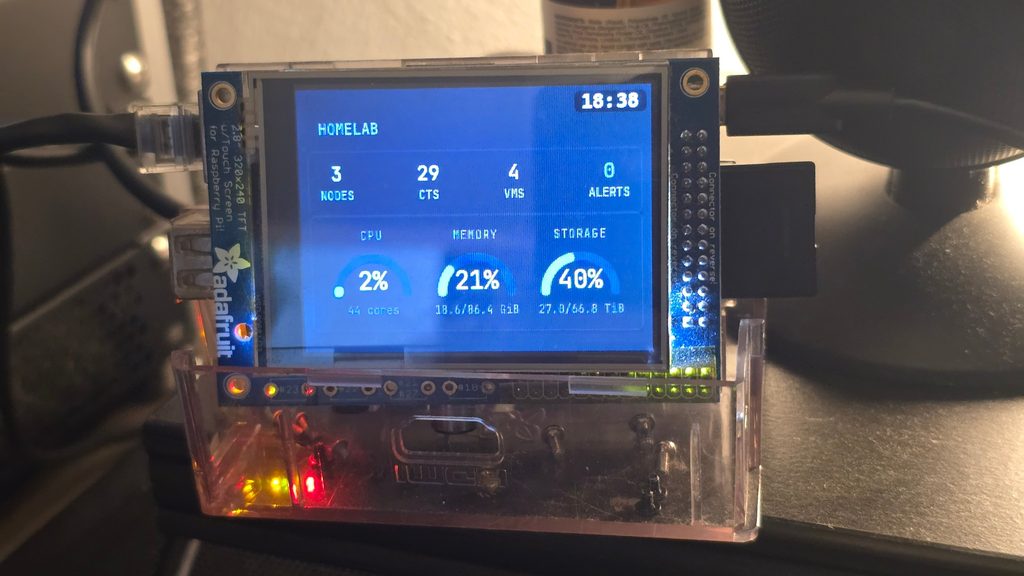
The cluster renders. The Pi displays.
A second copy of the dashboard runs on the server, bound to localhost with no login on it. Headless Chromium screenshots it every 60 seconds at exactly 320×240 and drops the PNGs in a folder. A tiny web server hands them out. The Pi’s entire job is: fetch a PNG, convert it to the framebuffer’s pixel format, write it to /dev/fb1, watch for taps.
That last part is about 300 lines of Python and it barely registers on the CPU. All the expensive work happens on a machine that can afford it.
The pleasant side effect is that the Pi holds no configuration worth backing up. If it dies I reflash it and it’s back in ten minutes.
What It Looks Like
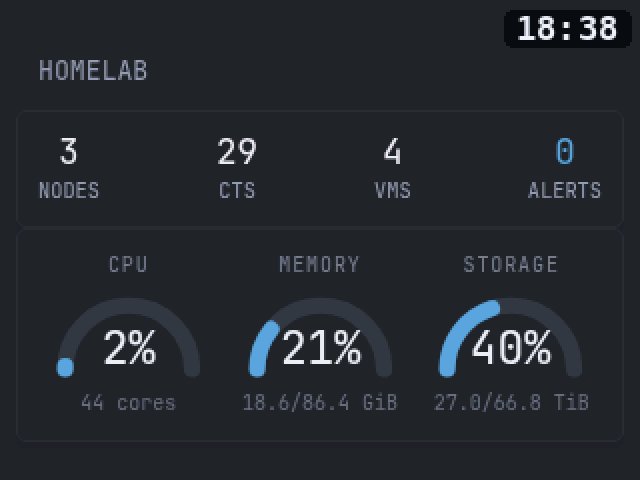
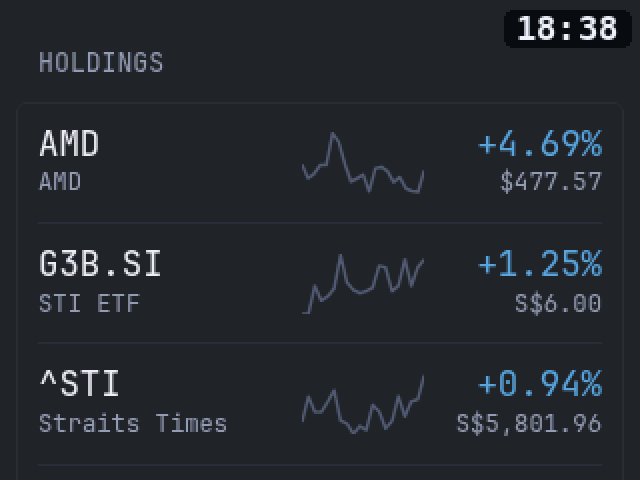
Both of those are read straight out of the Pi’s framebuffer rather than photographed, so they are exactly, to the pixel, what the panel is displaying. 320×240 native, shown here at double size.
Four Things That Reported Success While Failing
This is the part worth writing down.
Chromium returns exit code 0 when it refuses to take your screenshot. I was writing to a temporary filename ending in .png.tmp, so the write could be swapped into place atomically and the Pi would never fetch a half-finished file. Chromium doesn’t like that: Unsupported screenshot image file type: .tmp. Fair enough. But it prints that to stderr and then exits zero, so set -e sails straight past it and the script cheerfully carries on to a file that was never created. The staging name has to end in .png, and the script now checks the file exists before trusting it.
The dashboard’s fade-in animation poisoned the screenshots. Every so often a frame came out dim and barely readable. Not blank — the numbers were correct, just ghostly. The dashboard fades content in over about 0.3 seconds, and those animations are set to hold the starting state before they run. That starting state is fully transparent. Chromium was sometimes photographing the fade. The only external symptom was the PNG dropping from 4794 bytes to 3130. I now disable animation entirely for the panel copy; a still image has nothing to animate. Four consecutive renders afterwards were byte-for-byte identical.
Boolean options in the Pi’s boot config are silently ignored if you don’t give them a value. I needed to flip the touchscreen axes, and the display overlay supports exactly that. I wrote touch-invx,touch-invy on the config line. The overlay loaded, the screen worked, the rotation applied — and the touch settings simply didn’t exist. Not an error, not a warning. Searching the live device tree for them returned nothing at all. They need to be written as touch-invx=1. Everything around them working made it much harder to spot than a clean failure would have been.
sudo told me it didn’t need a password, and it was lying. Early on I tested sudo -n true and it succeeded, so I noted the account as passwordless and moved on. After a reboot it started demanding a password. The account never had a passwordless rule. What it had was a cached sudo timestamp from my own login session minutes earlier, which the reboot cleared. A single successful sudo -n proves nothing if anyone has recently used sudo on that box.
Rotation Is Two Settings, Not One
The picture came up upside down. Easy fix — change the rotation in the boot config, reboot.
The picture came back the right way up and the touch controls were now backwards.
Display rotation and touch orientation are configured independently. They’d been in agreement purely by luck. Rotating the display 180° necessarily put the touchscreen 180° out, and both have to move in the same edit.
Then it got better. After fixing the display, tapping the left and right edges did nothing at all — but tapping the top and bottom paged forward and back. The touchscreen’s X axis runs along the screen’s vertical. Not a calibration problem; the taps register cleanly across the full range. The two axes just aren’t mapped the way the physical mounting suggests.
There’s an option to swap them. I left it alone — top and bottom work fine, and I’d rather have one honest comment in the code than another reboot.
Three Gauges In A Hundred Pixels
I wanted the CPU, memory and storage arcs my hypervisor shows on its own summary page. Getting the numbers was the easy-looking part that wasn’t.
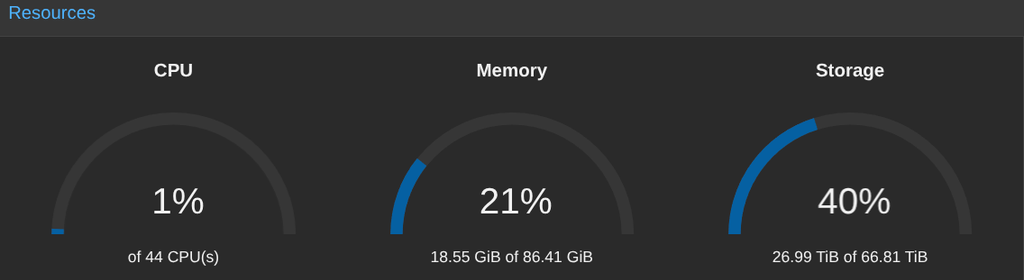
The monitoring tool’s summary endpoint returns what is running — nodes, containers, VMs — but not how hard any of it is working. Those figures live in the full state endpoint, which is 144 KB and needs filtering and summing across 48 entries of five different kinds. Doing that inside a dashboard template would have been miserable and fragile, so a small script does it on the server and writes about 300 bytes of JSON into the folder that already serves the screenshots. No new service, no second port.
CPU has to be weighted by core count, not averaged. My three nodes are 16, 16 and 12 cores. A plain mean would let the 12-core box shift the cluster figure as hard as a 16-core one, which is quietly wrong in a way nobody would ever notice on a wall panel. Weighting by cores gives 44, and the memory and storage totals then reconciled exactly against the hypervisor’s own summary — which is the only reason I believe the aggregation is right rather than merely plausible.
Captions have to be rewritten for the width, not shrunk to fit it. “26.99 TiB of 66.81 TiB” is 21 characters. In a column about a hundred pixels wide there is no font size at which that is both readable and contained. Shrinking it made it illegible; keeping it legible made it silently overflow into the neighbouring gauge, because nothing clips it. The panel now gets “27.0/66.8 TiB” instead — one unit, one decimal, 13 characters — while the long form stays available anywhere with room.
And one last small trap. Stacking the gauges under the existing counters overflowed the 240-pixel height, and the obvious saving was the second card’s redundant header. So I removed the widget’s title. The dashboard responded by rendering the words “CUSTOM API” in its place — same height, worse label. The fix was to keep the title and hide it in CSS, scoped so that it only ever affects a widget that follows another one.
The Clock, and a Missing Chip
I added a clock in the corner afterwards, because why not? :p
I draw it on the Pi, not in the dashboard. A dashboard widget would belong to one page and scroll away with it. The clock has to sit in the same corner on every page, so it gets composited onto each frame after it arrives. It also means the clock keeps ticking if the server goes down.
And it’s in a monospace font, because proportional digits change width as the time ticks over and the badge visibly jiggles every minute.
The other thing: a Raspberry Pi of this vintage has no real-time clock. No battery, no chip. It has no idea what time it is at power-on and depends entirely on the network to find out. A desk clock that is confidently and precisely wrong is worse than one that admits it doesn’t know, so it shows --:-- until the time sync actually confirms.
What I’d Tell Someone Starting
Check what the hardware is before you design for it. Five minutes reading /proc/cpuinfo reshaped this entire project. Had I assumed a modern Pi I’d have spent an evening fighting a browser that was never going to run.
Old hardware is fine if you give it the right job. This board is fourteen years old and it is genuinely good at fetching a small file and writing it to a screen. It was never going to be good at rendering HTML. The build got easy the moment I stopped asking it to.
Verify the thing itself, not the exit code. Four separate failures here announced success. Check that the file exists. Search the device tree for the setting. Read the framebuffer back and look at the actual pixels — which is how I confirmed the panel was working before I’d even seen it.
And the screen was blank for a while at the start, which worried me until I checked and found the framebuffer was all zeros. Nothing had ever drawn to it. It wasn’t broken. It was empty, which is exactly what it should have been, and I nearly went looking for a hardware fault instead of reading the thing in front of me.